
In short: the metric that best measures the profitability of a solar installation is its net profit or NPV: what the investment leaves over its lifetime once what it cost is deducted. Neither kWp nor kWh per m² measures profitability on its own. In our simulation of a 1,500 m² roof in Madrid, VectHor installs less power than other fixed layouts, but delivers the highest NPV of all.
When the first results from our pilot installation in Lemoiz (Biscay, Spain) were shared on LinkedIn, where the VectHor system produces 58.5% more energy per installed kWp than a fixed system tilted 10° south at the same site (data updated to 30 September 2026), one question kept coming up: «and how much does it produce per m²?» It is a very reasonable question, so we will try to answer it with numbers and explain where each one comes from.
How to measure an installation and what each metric tells you
Installed power (kWp)
This is the sum of the modules’ rated power. It is used to size the inverter, the grid connection and much of the budget, because modules, structure and electronics are paid for roughly per kWp. On its own, it says nothing about how much energy that power will produce. So, on its own, it is a rather imprecise metric.
Specific yield (kWh/kWp)
This is the energy each kWp produces in a year. It is a common metric for comparing technologies, because it lets you compare installations of different capacity: a kWp that generates 1,500 kWh a year is not the same as one that generates 2,400 kWh. When we say VectHor produces 58.5% more than a fixed installation in Lemoiz, we are talking about specific yield. Knowing the installed power and the specific yield, we know how much energy the installation will generate each year.
Output per area (kWh/m²)
This is the energy produced by each m² of roof. In industrial self-consumption, space is usually limited, so it is indeed a very relevant metric. Even so, what ultimately determines a project’s profitability is not the amount of kWh that comes out of each m², but how much money each m² leaves: a kWh produced when the factory is consuming is worth much more than one exported to the grid at midday. That is why this metric must be interpreted together with the value of that energy and its cost, never on its own.
Net profit (NPV): the metric that decides
None of the three previous metrics tells you how much money the installation will generate. That is what the net present value (NPV) tells you: the net profit of the investment. It is calculated by adding up what you save or earn each year over the installation’s lifetime and subtracting the initial investment and the costs of operation, maintenance and financing. Future amounts are discounted to today’s value. It is the decisive metric, for three reasons:
- It combines output and value. Each kWh counts for what it is worth in the hour it is produced, which is not the same at midday as at eight in the evening.
- It deducts the investment. Two installations that produce the same are not equally profitable if one costs 50% more.
- It compares options of different size. On the same roof, a higher NPV means more profit for the owner, whatever the installed power.
The levelized cost of energy (LCOE) complements the NPV: it tells you how much it costs to produce each MWh, but not what value we will be able to capture for each MWh produced, because it does not take the value of the energy into account. That is why, in this article, the decisive criterion for comparing installations is NPV, total and per m², with LCOE as support.
IRR and payback period
Together with NPV, these are the key metrics in any investment decision, in any field. The IRR (internal rate of return) is the annual return on each euro invested: it lets you compare the installation with any other investment the company could make, or with its cost of financing. The payback period tells you in how many years the investment is recovered: the shorter it is, the lower the risk and the sooner cash is freed up.
Neither replaces NPV, which measures the total profit the roof delivers: a small installation can have a high IRR and a low NPV. That is why the three financial metrics have to be read together. In the comparison in this article, VectHor comes out best on all three.
How much power fits in each m² with VectHor
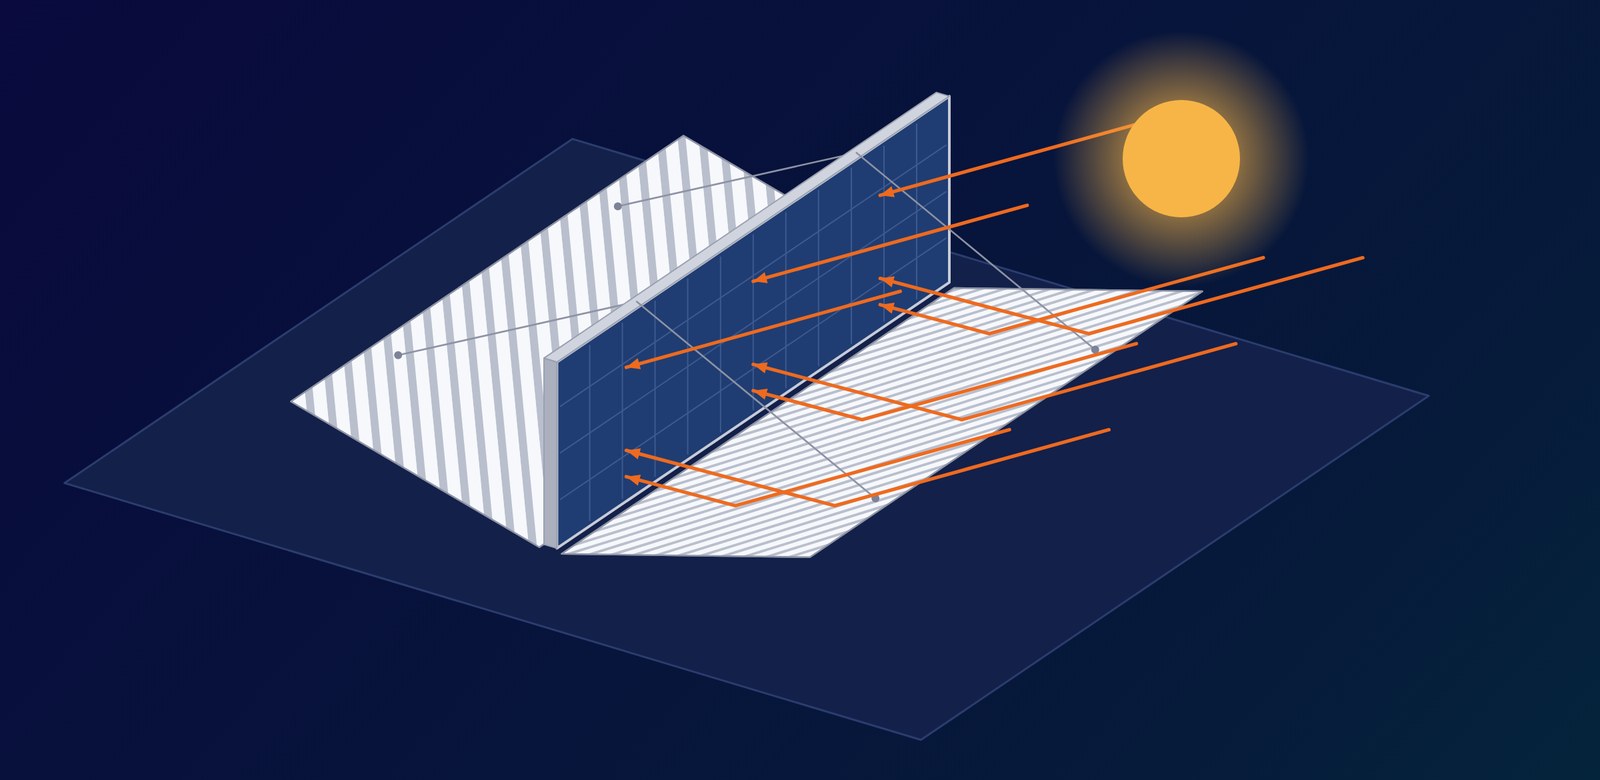
Each VectHor5 unit carries a 175 Wp bifacial module, facing east and west, between two specular reflectors tilted about 20°. With the row spacing used by our calculator, about 73 Wp fit per m² of roof, or about 73 kWp per 1,000 m².
That may seem low, because an east-west installation at 10°, with the modules almost flat and barely any space between rows, could fit almost three times as much power on the same area. A fixed south-tilted installation, which needs space between rows to avoid shading, sits somewhere in between. But power per m² is not what decides: the question is whether less power really translates into less energy and less money.
VectHor5 has a standard design, with dimensions chosen to make it versatile and highly profitable for most customers. Even so, the technology allows other configurations: for example, narrower reflectors would allow more power, and more energy per m², on the same roof.
The comparison: four layouts on the same roof
The figures in this comparison come from simulations, not measurements. We took them from our solar PV income calculator, based on FVlib, our software validated against field data (2.2% error in output), for a 1,500 m² industrial roof in Madrid with four layouts. The ground coverage ratio (GCR) of each layout is the one used by the calculator, estimated from real installations published in industry media. All of them use the same assumptions: no battery, 40% equity, a 15-year loan at 4%, 3% inflation and a 25-year NPV with a 4.5% discount rate, with energy valued at the market price of each hour. You can reproduce each case in the calculator with those parameters.
In every layout we installed all the panels that fit on the roof, so that they are compared on the same area. In practice this is often unnecessary: power is sized to each company’s consumption, and filling the roof beyond what is consumed only adds surplus.
The value of energy is modelled with 2025 market prices. In 2026, with more hours at zero or negative prices around midday, VectHor’s advantage in value per kWh is even greater than in this simulation. We preferred to be conservative, and even so VectHor delivers the highest net profit (NPV) per m².
This is a generic case to illustrate how to compare. The results of each project depend on its location, its roof, its consumption profile and its tariff, and have to be assessed in detail one by one.
| Metric | VectHor | Fixed 20° south | East-west 10° | Single-axis tracker |
|---|---|---|---|---|
| GCR | 0.33 | 0.61 | 0.90 | 0.40 |
| kWp on the roof | 109 | 203 | 297 | 132 |
| CAPEX (€/kWp) | 880 | 672 | 648 | 737 |
| Total investment (k€) | 96 | 136 | 192 | 97 |
| kWh/kWp per year | 2,459 | 1,647 | 1,470 | 2,097 |
| MWh per year | 268 | 334 | 436 | 277 |
| Revenue (€/m² per year) | 16.8 | 19.1 | 23.3 | 16.3 |
| kWh/m² per year | 179 | 223 | 291 | 185 |
| Captured value (€/MWh) | 94 | 86 | 80 | 88 |
| NPV (k€) | 205 | 186 | 183 | 181 |
| NPV per m² (€) | 137 | 124 | 122 | 121 |
| LCOE (€/MWh) | 28 | 35 | 38 | 31 |
| IRR (%) | 31.7 | 21.9 | 16.7 | 28.2 |
| Payback (years) | 3.4 | 5.2 | 7.1 | 3.9 |
Source: FutureVoltaics simulations with our solar PV income calculator (based on FVlib) for a 1,500 m² roof in Madrid. These are not measurements. GCR, CAPEX, captured value, NPV and LCOE are the calculator’s. kWp is derived from each layout’s AC power and DC/AC ratio, and the kWh/kWp and kWh/m² columns by dividing energy by power and by area.
What the table shows
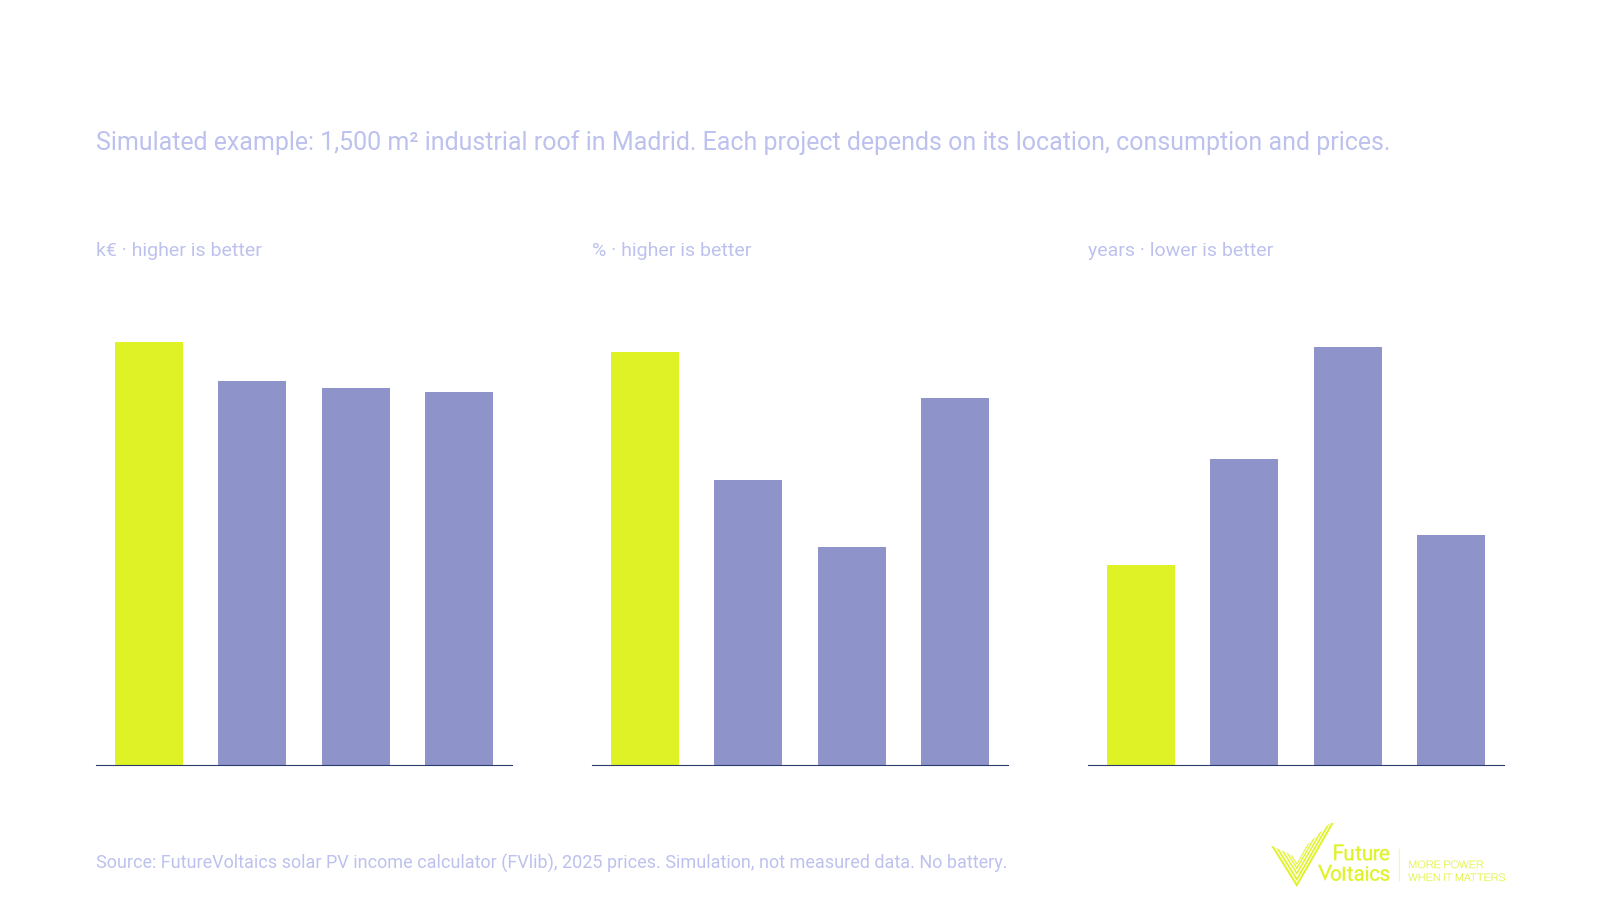
The first thing to look at is NPV, because it is the net profit the investment delivers. On the same roof, VectHor delivers 205 k€, against 181-186 k€ for the other layouts. The other columns explain why.
- Denser layouts get more gross kWh out of the roof, because they install much more power. But much of that extra energy arrives at midday, when it is worth least, and it requires more investment. That is why the metric that decides is NPV.
- Each VectHor kWp yields more, and its energy is worth more. It produces 2,459 kWh per kWp per year, 67% more than the east-west and 49% more than a fixed system at 20°. And because it produces more in the expensive hours, it captures 94 €/MWh, against 80-88 €/MWh for the rest.
- In profit per m², VectHor comes first. It delivers 137 € of NPV per m², against 121-124 € for the others. It also has the lowest cost of energy: 28 €/MWh, against 31-38 €/MWh.
Why more kWh does not mean more profit
The total investment grows with installed power
The investment in a solar installation is usually referenced to its capacity in kWp: more power means more modules, inverters, cabling, structure and installation hours. The east-west at 10° in the table needs about 192,000 € of investment for its 297 kWp; VectHor, about 96,000 € for its 109 kWp. 63% more energy costs twice the investment, and that energy is also worth less, as shown below.
The value of energy depends on the hour
With the amount of solar capacity installed in Spain, the midday wholesale price falls to zero or below more and more often. According to data from the market operator (OMIE) reported by El Independiente, by the end of February 2026 there had already been 110 hours with zero or negative prices, against 14 in the same period of 2025. That same week, the price was negative at midday and exceeded 175 €/MWh at 8 pm.
A dense installation concentrates its output in those midday hours. VectHor shifts output towards the morning, the afternoon and the winter, when energy is worth more. These are hours when companies have loads that, because of their profile, a conventional installation never manages to cover, and that they currently buy from the grid when the electricity market is most expensive and network tariffs and charges are highest. That is why the gain in revenue over a fixed system exceeds the gain in energy: in Lemoiz, from commissioning at the end of January to 30 September 2026, VectHor has produced 58.5% more energy per kWp and 73.1% more revenue at each hour’s market price.
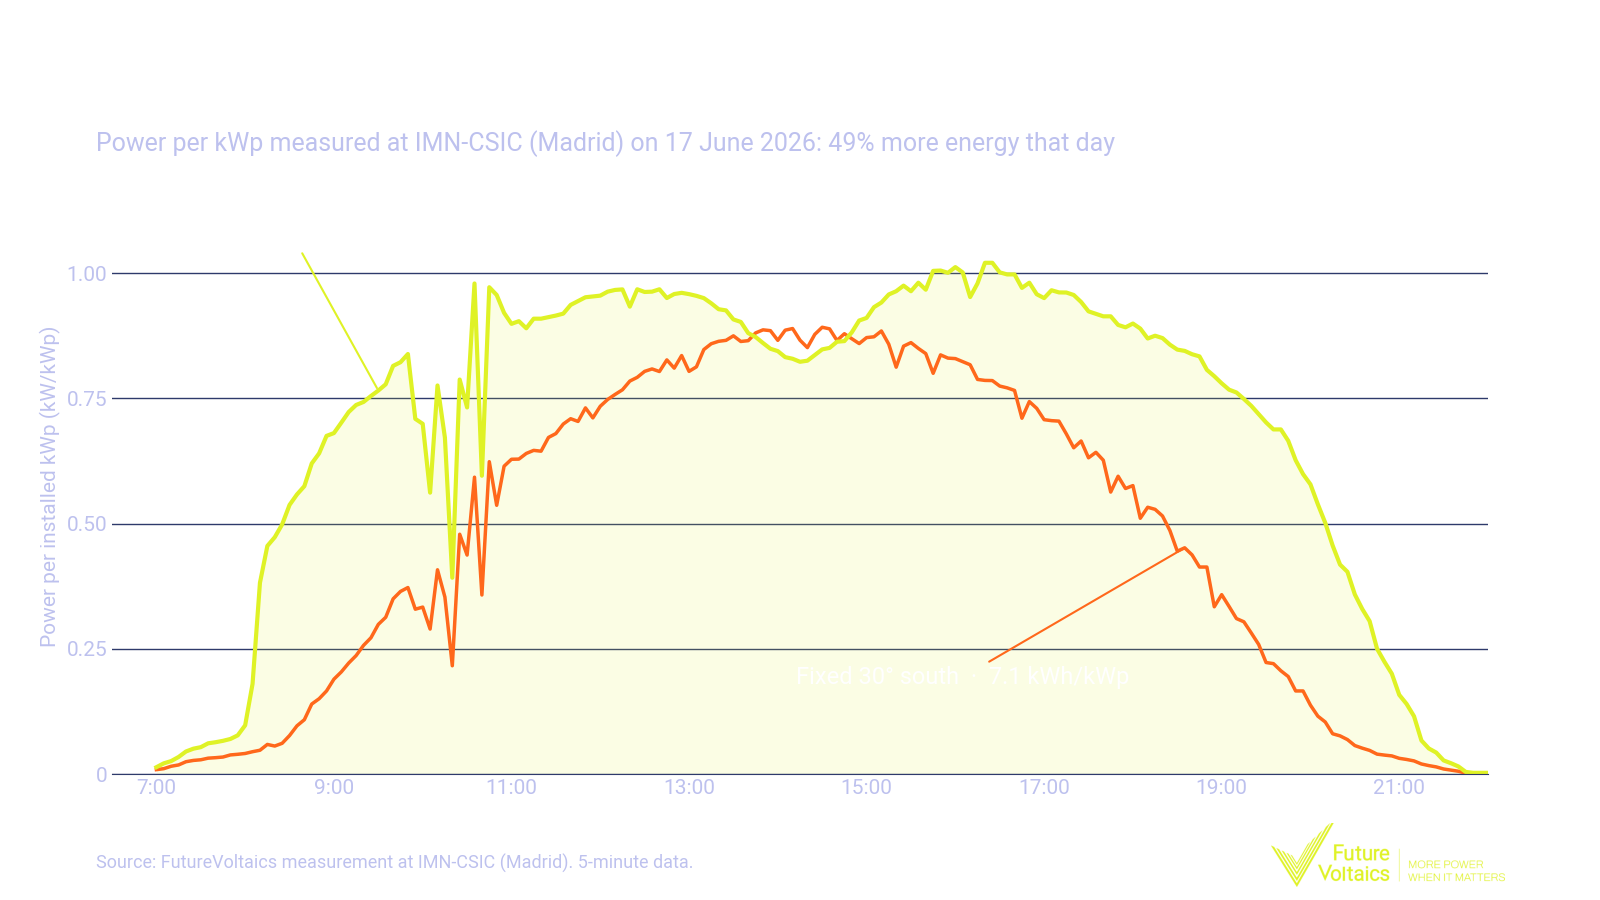
That timing matters as much as quantity is also documented beyond our technology. A study published in Applied Energy on vertical bifacial east-west installations (Jouttijärvi et al., 2024) found that orienting the modules east and west reduced output by 23.2%, but economic value by only 12.6%: the value of energy depends as much on when it is produced as on how much. VectHor does not have to give anything up: by following the sun it produces more energy per kWp than a fixed system, and it does so in the hours when energy is worth more. We explain this in more detail in The value of solar energy and timing and in the duck curve.
More panels, more surplus
In self-consumption, energy you do not use at midday is exported to the grid at a low price, or lost if export is limited. There comes a point where adding panels only adds surplus. That is why, in a self-consumption installation, kWh per m² overstates the value of dense solutions. NPV does capture this effect, because it only counts energy for what it is worth.
When it does make sense to fill the roof with panels
Filling the roof with a roof-parallel installation only makes sense in specific cases:
- When consumption follows the natural shape of solar output, peaking at midday with hardly any load the rest of the day, so that even with the roof full of panels all the energy is self-consumed.
- When the goal is to cover a given amount of annual energy, for example for a certification, rather than profitability.
Even in these cases, the decision should be based on NPV, IRR and LCOE, not on kWp or kWh per m². And a battery does not change the conclusion: VectHor also makes better use of it, as we will explain in a coming article.
How to run the comparison on your roof
- Measure the usable area, excluding walkways, skylights, equipment and shaded zones.
- Calculate how many kWp fit with each layout. With VectHor, about 73 kWp per 1,000 usable m².
- Simulate output hour by hour, not just the annual total, and match it against your consumption profile.
- Value each hour at your tariff or at the market price, depending on how much you self-consume and how much you export.
- Compare the NPV of each option, which is what decides, with the same financial assumptions for all of them. IRR, payback and LCOE serve as support.
You can make a first estimate for your location with our solar PV income calculator. If you would like a full study of your roof with FVlib, get in touch. To understand how VectHor works, see our technology page and the article VectHor: a solar tracker with no moving parts.
Frequently asked questions
Which is better for comparing installations, kWp or m²?
Neither on its own. kWp indicates the size of the installation; kWh per m², the roof’s gross energy. To decide, you need to compare NPV, the net profit of the investment, under the same assumptions. LCOE complements it.
How many kWp of VectHor fit on 1,000 m² of roof?
About 73 kWp, according to our solar PV income calculator. The real usable area depends on walkways, equipment and shading.
How does VectHor compare in energy per m²?
It installs less power per m² than denser layouts, but each VectHor kWp yields much more (67% more than an east-west at 10° and 49% more than a fixed system at 20° south), which offsets much of that difference. Against a single-axis tracker, energy per m² is practically the same. Above all, it produces in the hours when energy is worth more.
Why is VectHor more profitable with less installed power?
Because it needs less investment and produces in the hours when energy is worth more: it captures 94 €/MWh, against 80-88 €/MWh for the rest. On the simulated roof in Madrid it delivers 137 € of NPV per m², against 121-124 € for the other layouts. And it is by far the fastest to return the investment: an IRR of 31.7% and payback in 3.4 years, against 16.7-28.2% and 3.9-7.1 years for the rest.
Are the figures measured or simulated?
The +58.5% in Lemoiz is a measurement from the end of January to 30 September 2026, against a fixed system at 10° south at the same site. The Madrid roof comparison is a simulation with our calculator, based on FVlib, which has been validated in the field with a 2.2% error.
Do I need a battery with VectHor?
It depends on your consumption profile, but in many cases it is not essential. By spreading output across the day, it covers more direct consumption and, if you do want a battery, you need a smaller one.
Sources
- FutureVoltaics, measurement of the Lemoiz pilot installation against a fixed system at 10° south, from the end of January to 30 September 2026.
- pv magazine: Pilot tests show vertical PV system with specular reflectors delivers 50% higher yield (July 2026; first five months).
- FutureVoltaics, solar PV income calculator (based on FVlib): 1,500 m² roof in Madrid, October 2026.
- FutureVoltaics, measurement at IMN-CSIC (Madrid), 17 June 2026.
- El Independiente, with OMIE data: La paradoja solar de España: precios negativos de la luz en 2026 (February 2026, in Spanish).
- Jouttijärvi, Karttunen, Ranta and Miettunen: Techno-economic analysis on optimizing the value of photovoltaic electricity in a high-latitude location, Applied Energy 361 (2024).


